
Description
Stormwater harvesting systems use treated stormwater from a catchment for beneficial purposes, reducing the stormwater volume and mass of pollutants discharged from storage areas such as a wet detention pond. It is often used in series with wet detention in the same catchment.
Harvested stormwater can be used for numerous applications including:
- Irrigating lawns and landscape beds
- Irrigating greenroofs
- Washing vehicles
- Industrial cooling
- Toilet flushing
It can replace potable water used for irrigation, reducing dependence on potable water supplies.
To properly design a stormwater harvesting system that results in a predictable average annual mass removal, water budgets are used. The development of a water budget quantifies capture of runoff or reduction in offsite discharge over time.
The water budget accounts for:
- Storage volume
- Rate of use
- Discharge
Calculation requires knowledge of:
- Watershed soil and impervious characteristics
- Water use volumes and rates
- Desired percentage of stormwater runoff to be used
- Maximum volume of stormwater runoff storage
- Rainfall data
- Evaporation data
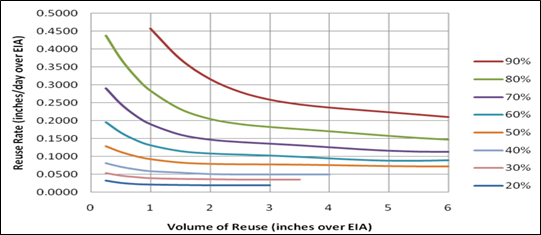
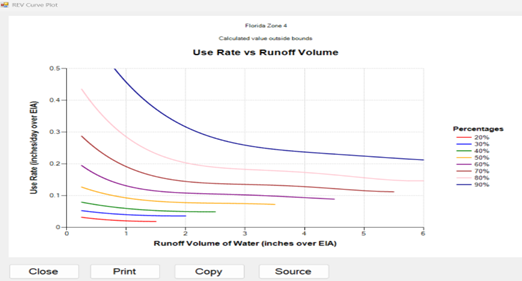
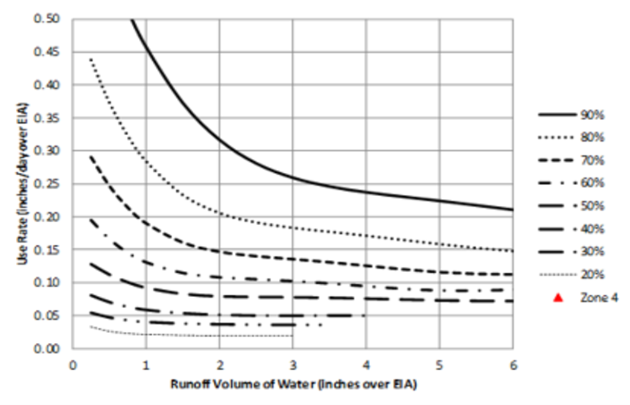
Rate-Efficiency-Volume (REV) Curves
Simulations of runoff and use from stormwater harvesting ponds over long time periods were conducted to determine effectiveness curves known as Rate-Efficiency-Volume (REV) curves.
REV curves are used to assess nutrient removal effectiveness.
Important assumptions when using REV curves:
- Net groundwater movement into or out of storage (pond) is assumed zero in a year.
- The use rate is the annual average and is presented on REV curves as an average rate per day over the Equivalent Impervious Area (EIA).
- Beneficial use of water from the pond occurs twice per week with no water use the day after rainfall, and is equal to or greater than the daily water amount. A sensitivity analysis showed less than one percent change in effectiveness.
- Rainfall on a wet pond equals evaporation from the wet pond in a year.
- Effectiveness results (REV curves) are long-term averages based on historical rainfall. Annual values vary.
- Drawdown of the permanent pool for beneficial use does not exceed 1 inch over the catchment to protect vegetation and aesthetics.
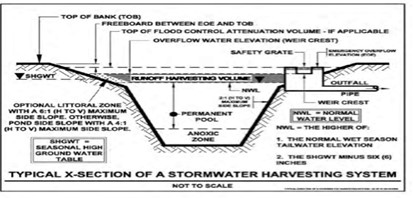
Storage Configurations
Various storage devices and physical arrangements are used.
If storage is underground:
- No evaporation
- No rainfall directly into storage
- No net groundwater exchange
Storage volume equals the volume of water used.
REV assumptions for surface ponds are applied to underground systems and provide reasonable runoff removal estimates.
Cooling and Wash Water Applications
Pond storage is often used for cooling water or vehicle wash water. Many such systems require a separate holding vessel with specific design volume.
This is typically supplied by pumping from stormwater storage twice per week.
Cooling or wash water use is converted from average gallons per week into:
- Inches per day
- Over the Equivalent Impervious Area (EIA)
Standard conversion factors are used.
Average effectiveness must consider:
Storage device effectiveness + REV effectiveness (series configuration).
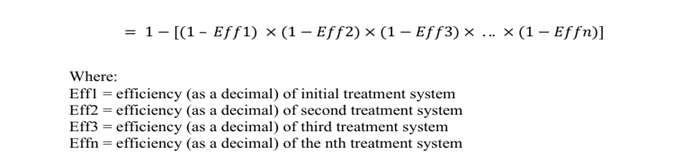
Series Removal Example
Example:
- 100 kg/year input
- 40 kg/year removed in wet detention
- 50% of remaining 60 kg/year removed by harvesting
Overall removal:
40 + 0.50(60) = 70 kg/year
The general series removal equation is found in the Applicant’s Handbook Vol 1, Section 9 (June 28, 2024).
Input Data
Required Inputs
Annual removal (capture for harvesting) depends on:
- Meteorological zone (one REV curve per zone)
- Irrigation area
- Maximum allowed harvest volume
- Harvesting rate
Typical irrigation rate in Florida:
0.5 to 1.5 inches per week (annual average)
Irrigation area × irrigation rate = harvested volume
Harvested volume may be expressed in:
- Gallons
- Acre-feet
These can be converted back to:
- Irrigation area (acres)
- Rate of use (inches per week)
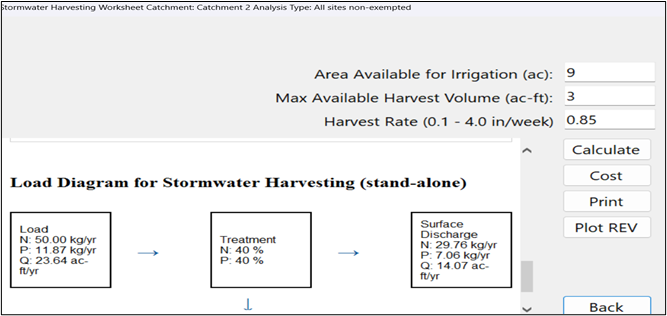
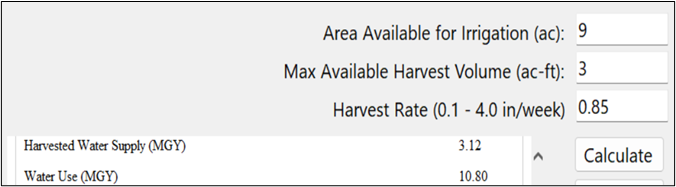
Example Input
Example:
- Irrigation area = 9 acres
- Harvested volume = 3 acre-feet
- Average harvest rate = 0.85 inches/week
Result:
40% capture of runoff water (for this location)
Additional Output Information
The analysis provides:
- Harvested Water Supply (MGY)
- Total Water Needed (MGY)
These values can be used for:
- Consumptive use permits
- Water use permits
Plot REV Option
The “Plot REV” button can be used for discovery analysis.
The software uses a polynomial curve-fit method to determine combinations of:
- Use rate
- Harvested volume
Curves are not perfectly smooth because they are polynomial fits.
Curve fits show marginal change in use rate and harvested volume, allowing optimization based on cost or other factors.
Continuous Equation Source
A smooth or continuous equation for each removal effectiveness can be viewed using the “Source” button.
Source:
Wanielista, M. P., Yousef, Y. A., Harper, G. M., & Dansereau, L. (1991). Design Curves for the Reuse of Stormwater. stormwater.ucf.edu/research/FILES/Wanielista
There is one equation per zone representing the average of rainfall station simulations within that zone.
Runoff Coefficient (ROC) Consideration
Early software releases assumed:
ROC = 0.8
This overestimated water use to be conservative for permit applications.
Example comparison:
- ROC = 0.325 → 7.673 MGY
- ROC = 0.8 → 12.83 MGY
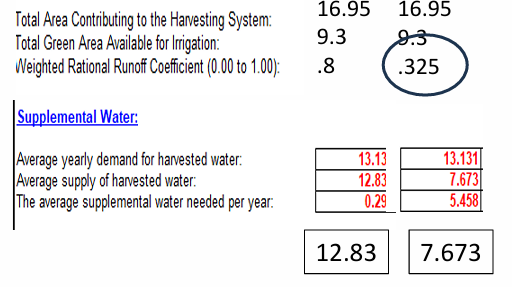
With publication of ROC values in Applicant’s Handbook Vol 1, Appendix N Table 1, more accurate harvested volume calculations are now used.
This results in improved estimates of:
- Capture
- Water supply
- Water use
Further guidance on consumptive use and water use permits can be found in:
- Applicant’s Handbook for Water Use Permit Applications
- SFWMD (June 13, 2022)
- SWFWMD (May 2014)
- SJRWMD (August 2014)